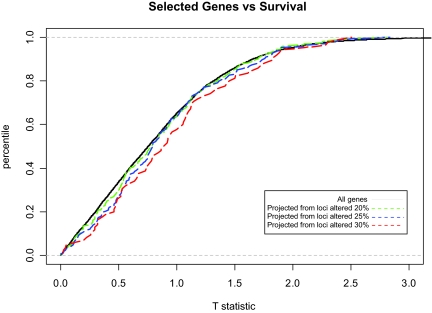
Figure 7:
Projection of variables among two data types: from measurements of DNA copy number by CGH to mRNA expression. Cumulative distributions of t-statistics of mRNA expression vs. survival for all genes (solid black line) or genes that are within 1MB of CGH loci whose log2 deviation from normal is at least 0.5 at a frequency of at least 20% (dashed green line), 25% (dashed blue line), or 30% (dashed red line) of samples. The difference between the distributions for all genes compared with those genes that map to loci that are altered in 30% or more samples is significant (p < 0.05 by Wilcoxon rank-sum test).

