Figure 8.
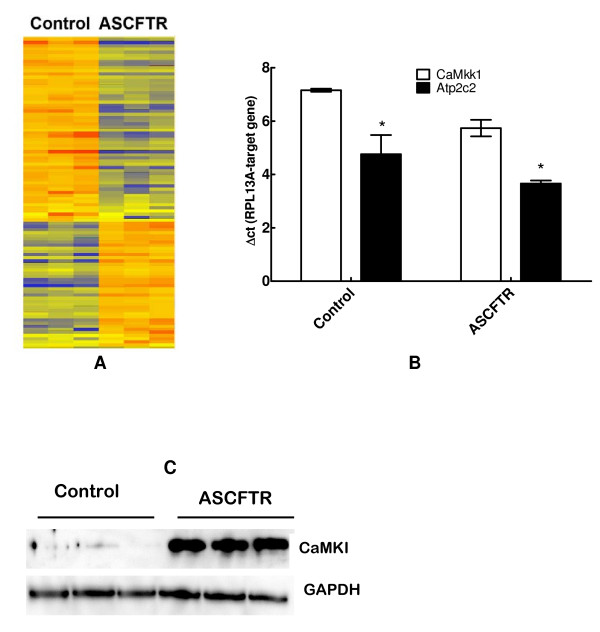
Gene array analysis of ATII cell RNA. Gene expression in adult type II cells isolated from animals that were infected in utero with adenovirus containing EGFP (Control) or ASCFTR constructs. A. Heat map for 101 genes in three separate preparations of type II cells demonstrating altered expression in the ASCFTR group in comparison to the Control group. B. Results of real-time PCR analysis of RNA from three separate preparations of freshly isolated type II cells showing enhanced expression of Ca2+-ATPase and calcium-dependent calmodulin kinase kinase1. Results (mean ± SE, n = 3) are expressed as change in threshold cycle for the target gene in comparison to the house keeping gene, RPL13A. A smaller ΔCt value indicates higher expression. * P < 0.05 in comparison to corresponding Control group. C. Western blot analysis showing elevated expression of calmodulin kinase I (upper panel) relative to house-keeping protein GAPDH (lower panel). The results of real-time PCR and Western blot analysis support the findings of Gene array analysis.

