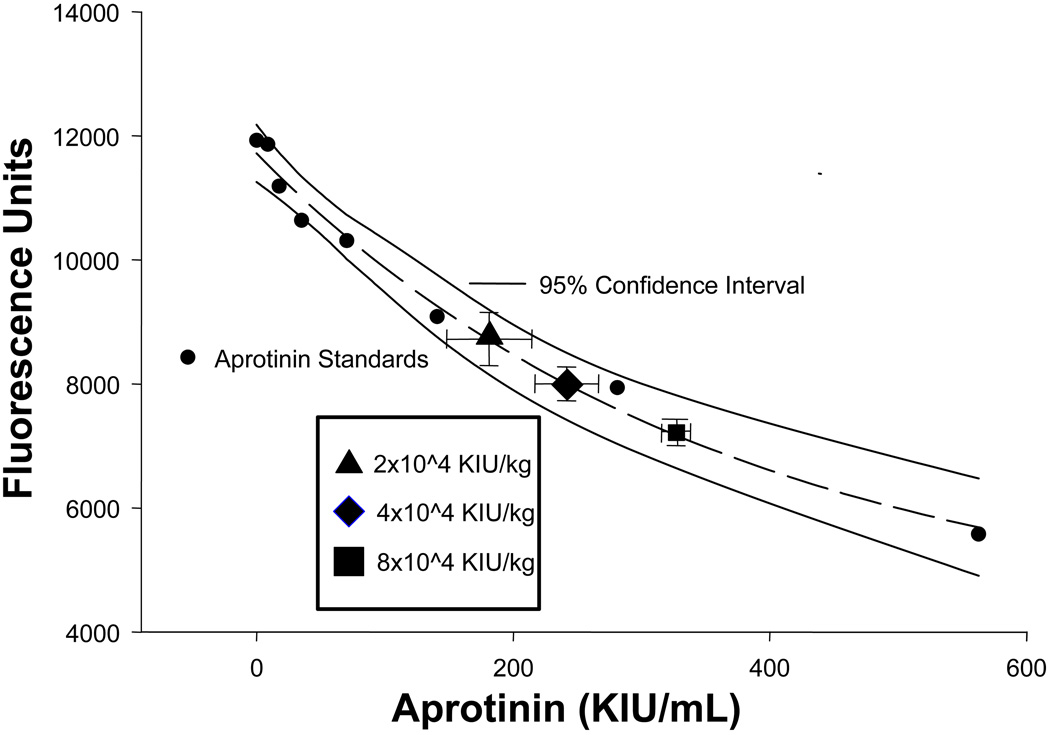
Figure 1.
Relative plasma concentrations of aprotinin (APRO). An excellent regression fit was obtained as shown by the dashed lines, and the 95% confidence interval for the APRO assay is shown by the solid lines. The relative fluorescence and computed plasma APRO concentrations for the Hammersmith doses have been superimposed on the standard curve (error bars are the standard deviation from the estimate) and absolute values are reported in the Results. The 2×10⁴ KIU/kg, 4×10⁴ KIU/kg, and 8×10⁴ KIU/kg dose nomenclature correlates to the half-Hammersmith, full-Hammersmith, and double-Hammersmith protocols presented in the Methods. Please see text for details.
(y = 4071+7643e−0.0028x; r2 = 0.98, p<0.0001)

