
Figure 3.
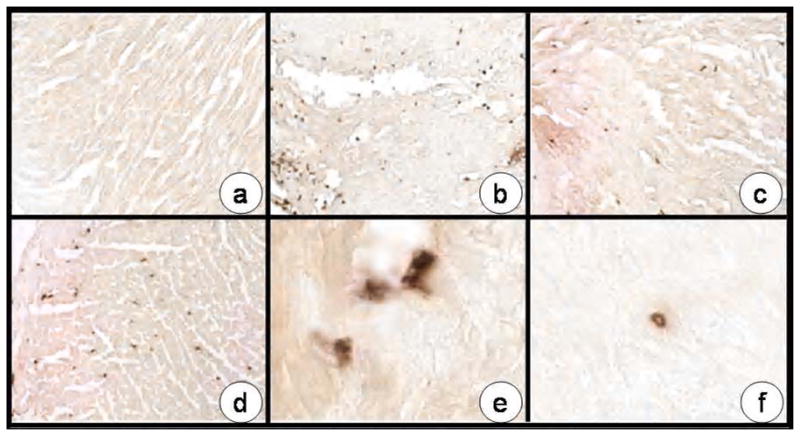
Representative photomicrographs of LV sections stained for myeloperoxidase (MPO) taken from: (a) reference control; (b) following I/R in the vehicle only group; (c) in the 2 ×10⁴ KIU/kg APRO group; and (d) in the 4 ×10⁴ KIU/kg APRO group. A significant and robust increase in MPO staining was observed in the vehicle group and while evident in the APRO groups, appeared reduced. Quantitative results are presented in Figure 2. Higher power images of an LV section taken from the vehicle group revealed an egress of MPO staining from interstitial cells (e) whereas in the 2 ×10⁴ KIU/kg APRO group, MPO staining appeared to be confined to the intracellular compartment of these interstitial cells (f). Original magnification: a–d: 20X, e,f: 63X.