
Figure 2.
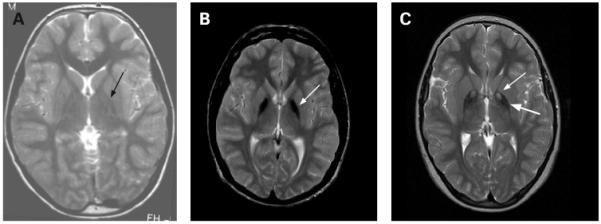
Patterns of iron accumulation on T2 weighted magnetic resonance imaging (MRI) of the brain. The image on the left is from a normal patient. The centre image from a patient with idiopathic neurodegeneration with brain iron accumulation (NBIA) (PANK2 mutation negative) has a region of hypointensity (arrow) seen in the medial globus pallidus. The right image from a patient with mutation positive pantothenate kinase associated neurodegeneration (PKAN) shows an eye-of-the-tiger sign with hypointensity (thick arrow) with a central region of hyperintensity (thin arrow) in the medial globus pallidus.