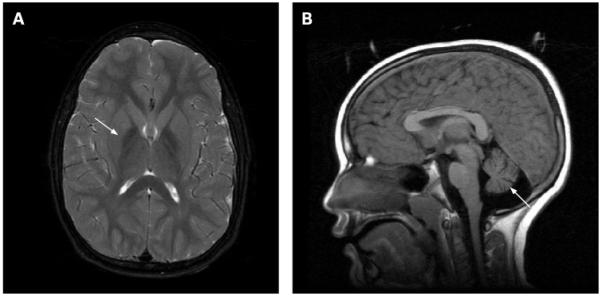
Figure 3.

Magnetic resonance imaging (MRI) findings associated with infantile and atypical neuroaxonal dystrophy. The image on the left shows a region of hypointensity (arrow) in the medial globus pallidus from a patient with PLA2G6 mutation positive infantile neuroaxonal dystrophy. The image on the right shows cerebellar atrophy (arrow) in the same patient. These findings appear similarly in patients with the infantile and atypical forms of disease.
