Figure 1.
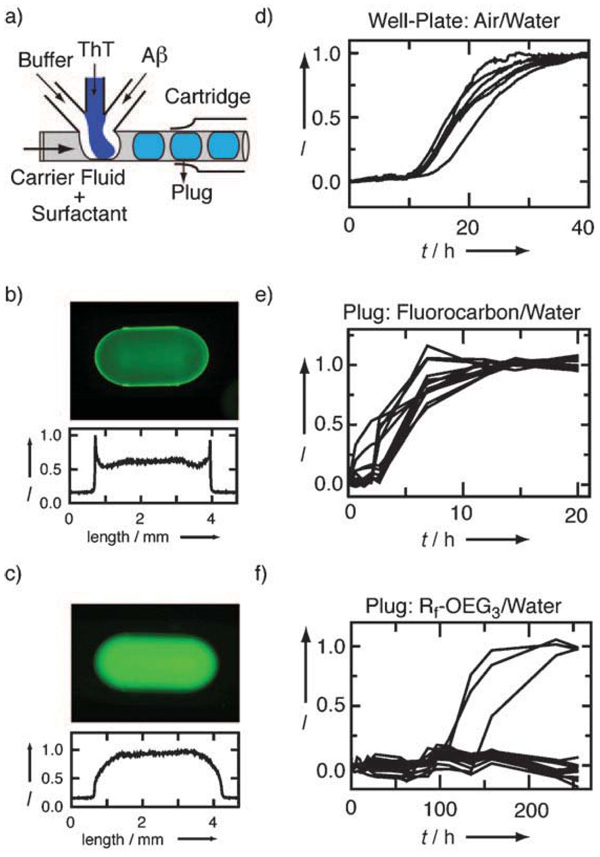
Encapsulation and aggregation of Aβ40 in plugs with controlled interfaces compared with plugs without interfacial control and with a well plate. a) Schematic of the microfluidic device. Fluorescence images of 22 µm HiLyte-488-labeled Aβ40 in plugs with b) fluorocarbon/water and c) Rf-OEG3/water interface. Corresponding line scans of the plugs are given below each image. Aggregation kinetics of 50 µm Aβ40 in 50 µm Tris buffer at 37°C measured by ThT fluorescence in d) a well plate with an air/water interface, e) plugs with a fluorocarbon/water interface, and f) plugs with an Rf-OEG3/water interface. Note the difference in timescales.

