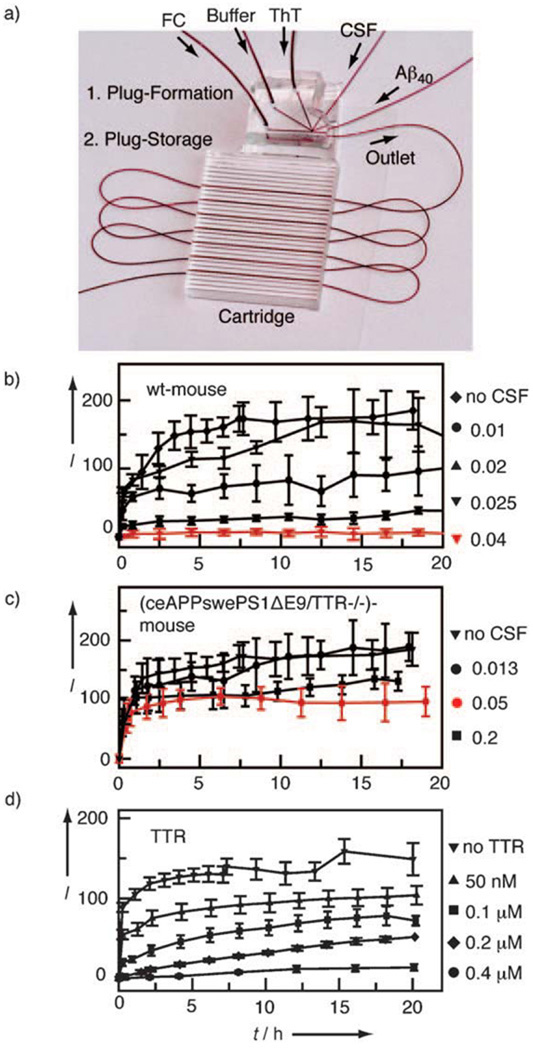
Figure 2.
CSF titration experiments. a) Microfluidic device designed for performing 250 aggregation trials of Aβ40 with different volume fractions of CSF or concentrations of protein. Aggregation kinetics of 50 µm Aβ40 on addition of various volume fractions of CSF b) from wild-type mouse and c) from a mouse which is a model for Alzheimer’s disease (ceAPPswePS1ΔE9/TTR-/-). The volume fraction is defined as the ratio of volume of CSF to total aqueous plug volume and is shown to the right of the graphs. d) Aggregation kinetics of 50 µm Aβ40 on addition of various concentrations of TTR. Aggregation was measured by ThT fluorescence, where I is the fluorescence intensity of ThT normalized to the fluorescence intensity at t = 0. Each data point is averaged over 15 plugs, and the error bars are the standard deviations.

