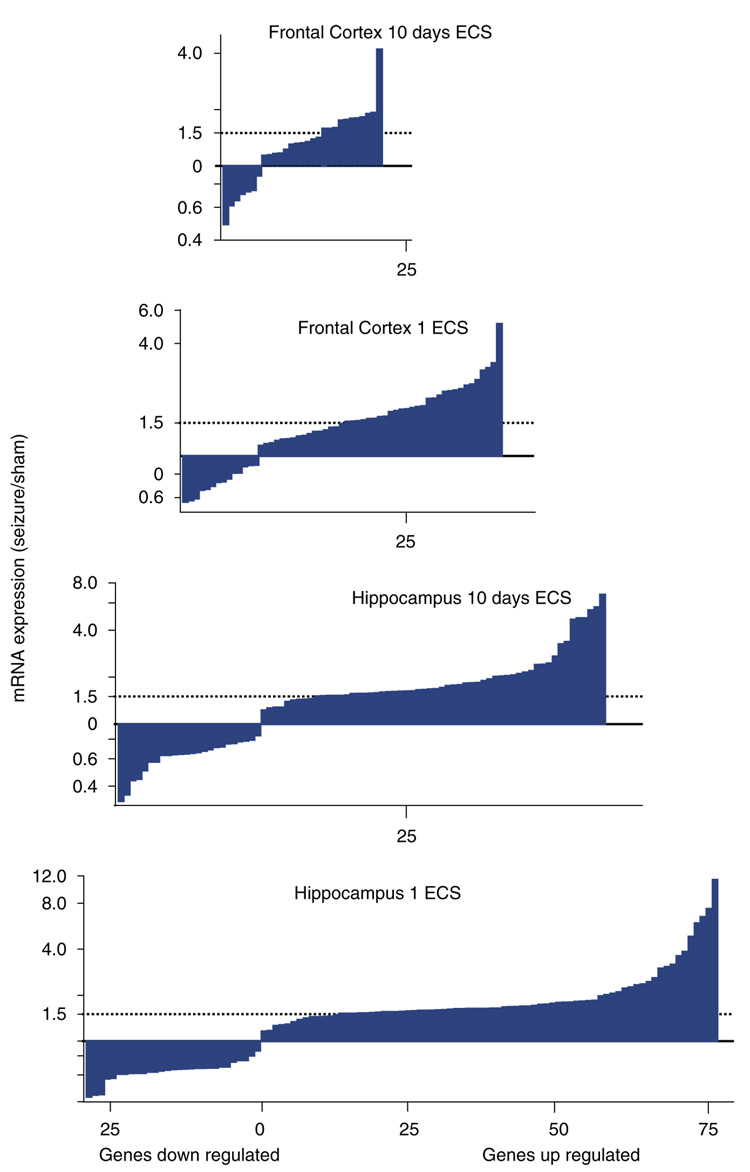
Figure 12.
Cumulative number (X axis) and fold change (Y axis) of gene changes in the frontal cortex and hippocampus of rats treated with acute or chronic ECS. For all genes that changed (p <0.05) from sham seizure control rats, the ratio of the mean expression in the ECS group over the control group is cumulated over the magnitude of change. In each graph, decreases are plotted below the unity line and increases are plotted above the line. The X axes for all four graphs are aligned at ‘0 genes changed’ and plotted at the same scale so that the width of the graph represents the number of genes that were significantly increased or decreased by ECS (Altar et al, 2004).

