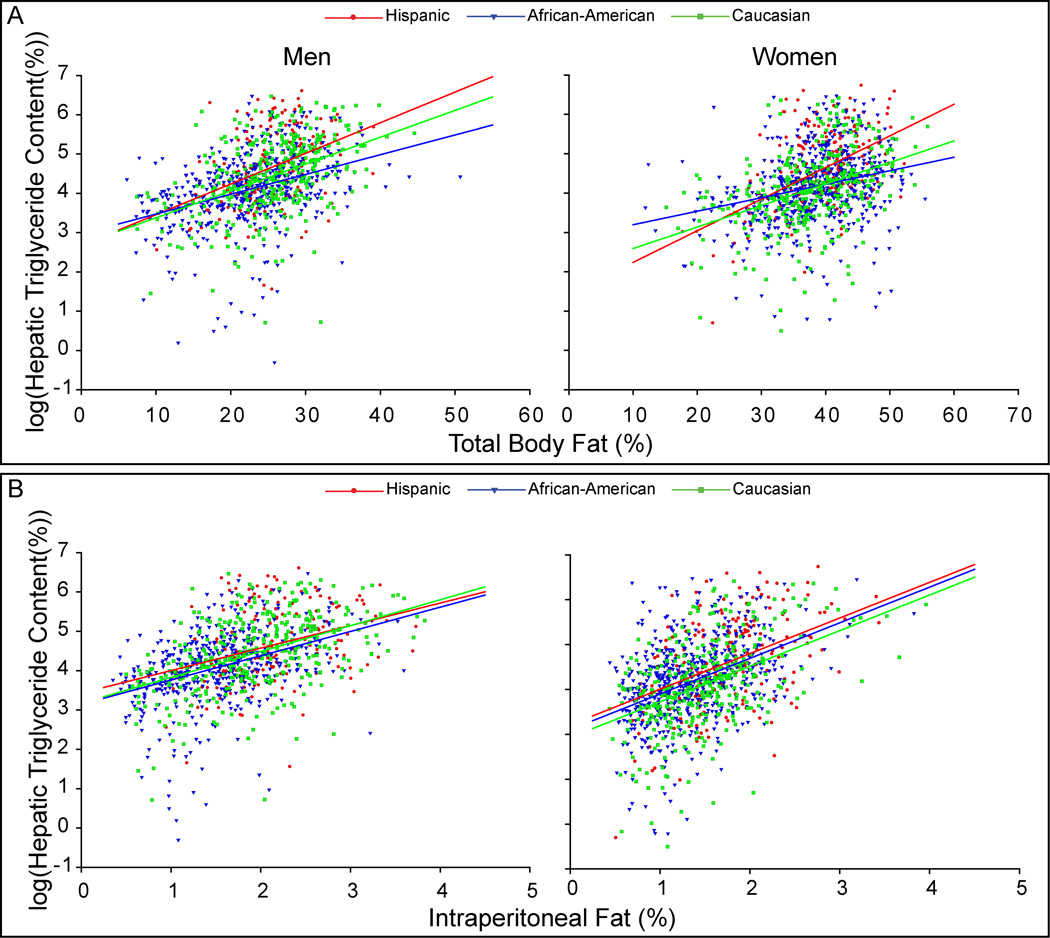
Figure 2. Relationship Between Hepatic Triglyceride Content and Total/Regional Adiposity.
Hepatic triglyceride content (HTGC) was log transformed to meet assumptions of ANCOVA analysis. As expected, HTGC increased as a function of total and regional adiposity in all groups, but this relationship varied by ethnicity. (A) The plot of HTGC vs. percent body fat (%BF) in men and women. In Hispanic and Caucasian men, the difference in slopes of this relationship was not significant (P=0.539); however, the slope of this relationship trended toward lower values in African-American men compared to the other ethnicities (vs. Hispanic, P=0.067; vs. Caucasian, P=0.054). Hispanics had the highest mean value of HTGC followed by Caucasian then African-American men after adjustment for %BF (P<0.033). Among the women, all ethnicities demonstrated different slopes for this relationship (P<0.025). The greatest slope was observed in Hispanic women followed by Caucasian then African-American women. (B) The plot of HTGC vs. percent intraperitoneal fat (%IP) (intraperitoneal fat mass / total body mass) in men and women. All regression lines had equal slopes and the ethnic-specific adjusted mean values of HTGC were similar among the men (Hispanics 4.2±1.0 vs. Caucasians 3.8±1.0 vs. African-Americans 3.5±1.0 %, P>0.05 for all comparisons). Among the women, all regression lines had equal slopes. The adjusted mean value of HTGC was similar between Hispanic and African-American women once adjusted for %IP (3.9±1.1 vs. 3.5±1.0 %, respectively; P=0.260). However, the mean value of HTGC in Caucasian women was slightly lower than the other ethnicities after adjustment for %IP (3.0±1.1 %, P<0.01). Adjusting HTGC for subcutaneous and lower extremity fat failed to account for the difference in HTGC between these ethnic groups. Indeed, adjustment for subcutaneous fat yielded results similar to adjustment for %BF. Likewise, the slope of the relationship between HTGC and lower extremity fat either approached zero (men) or was not significantly different from zero (women).

