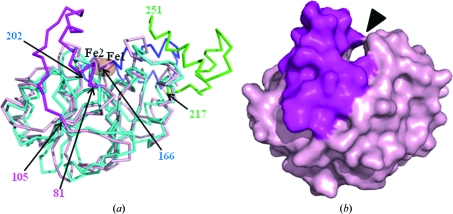
Figure 3.
(a) Superposed diagram of TTHA1623 (shown in pink) and 2qed (light blue). The region unique to TTHA1623, residues 81–105, is shown in magenta. The regions unique to 2qed, residues 166–202 and 217–251, are shown in blue and green, respectively. The residue numbers of TTHA1623 and 2qed are labelled in the diagram. (b) Surface diagram of TTHA1623. The region unique to TTHA1623 (residues 81–105) is shown in magenta and the putative substrate-binding pocket is indicated by an arrowhead. The viewing points of (a) and (b) are the same. This figure was drawn with PyMOL (DeLano, 2002 ▶).

