
Figure 3.
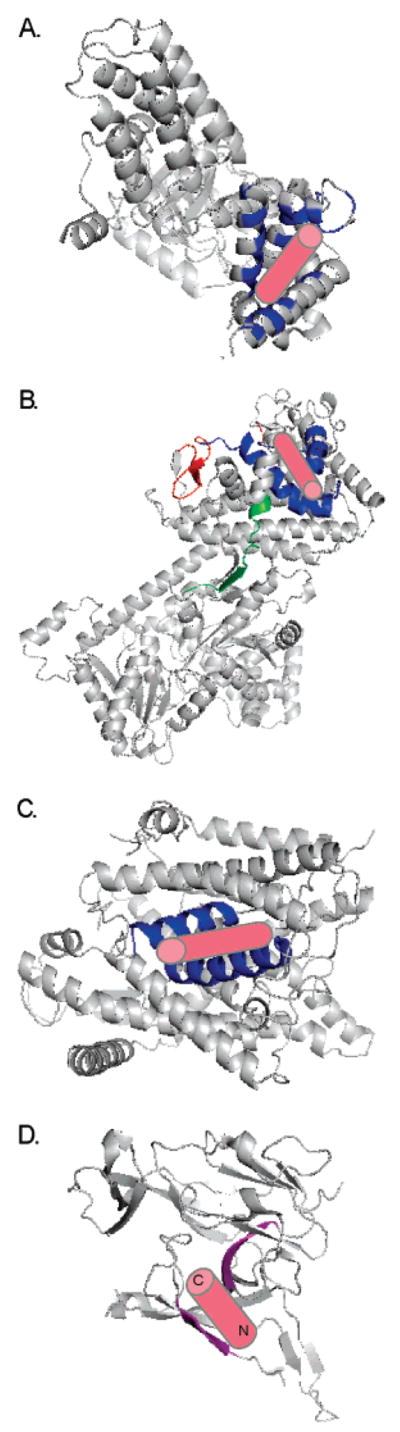
Models based on the crystal structures of Sec transport components with the predicted location of bound signal peptide (pink cylinder) illustrated: (A) Ffh from Thermus aquaticus (PDB ID 2FFH). Conserved residues that line the hydrophobic groove of the M-domain and are implicated in signal peptide binding are shown in blue. This region was entirely disordered in the E. coli structure (113) suggesting flexibility inherent in binding a variety of sequences. (B) SecA from Bacillus subtilis (PDB ID 1M6N). The residues proposed to bind signal peptide are shown in red (PPXD; 68), green (“stem” of PBD; 70), and blue (SPBG; 71). The signal peptide is shown as predicted in ref 71; the SPBG overlaps with the PPXD and is adjacent to the PBD “stem”. (C) SecYEβ from Methanococcus jannaschii (PDB ID 1RHZ). Cross-linking data suggest that helices two and seven (shown in blue) interact with the signal peptide (93, 94). (D) Catalytic domain of E. coli signal peptidase (PDB ID 1KN9). Molecular modeling suggested hydrogen bonding of the signal peptide to β-sheets (shown in purple) that line the shallow substrate binding pocket (99).