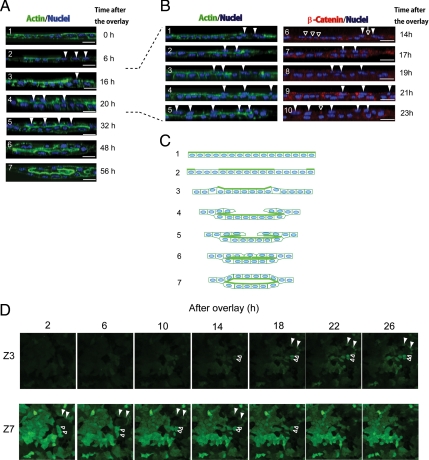
Figure 3.
A monolayer of HPPL folds up into tubular structures in sandwich culture. (A) Time course of tubular morphogenesis after the overlay. The overlay of ECM gel on a monolayer of HPPL induced exclusion of F-actin bundles from the apical domain, indicating depolarization of cells (arrowheads in panel 2). Panels 3–5 suggest that depolarized cells first migrated along the Z-axis (an arrowhead in panel 3) and then back along the bottom cell layer (arrowheads in panels 4 and 5). Finally, the apical luminal space was evident at 48 h after the overlay (panel 6) and then expanded (panel 7). X-Y images were taken every 0.7 μm along the Z-axis at each time point using a LSM510 confocal laser scanning microscope and images of a vertical (X-Z) section was reconstructed by using Zeiss LSM software. Scale bars, 20 μm. (B) Time course between 14 and 23 h after the overlay. Cells in the second layer (arrowheads) appeared in the right side of the image (panels 1 and 6) and then were observed also in the center of images (panels 2–4 and 7–9), and eventually reached to the left side (panels 5 and 10). β-Catenin localization at cell–cell contacts were clear between cells in the bottom layer (open arrowheads in panel 6) but not between cells in the second layer (an open arrow in panel 6). Later, β-catenin reappeared at cell–cell contact at 23 h (an open arrowhead in panel 10). X-Y images were taken every 0.5 μm along the Z-axis at each time point using an Olympus FV1000D IX81 confocal laser scanning microscope and images of a vertical (X-Z) section was reconstructed by using Olympus viewer software. Scale bars, 20 μm. (C) On the basis of images at different time points, we propose a model of in vitro tubular morphogenesis in which a monolayer of HPPL folds up into tubular structures. Thick green lines represent F-actin bundles. (D) X-Y images of time-lapse movies between 2 and 26 h after the overlay. HPPL were labeled with GFP. Images at 16 different X-Y planes along the Z-axis were taken in a selected area every 40 min using an Olympus FV1000D IX81 confocal microscope. Panels of the Z7 series show X-Y images of the original monolayer, whereas panels of the Z3 series show a X-Y plane above the monolayer where no cells were initially observed. As indicated by open and closed arrowheads, some cells disappeared from the Z7 plane and instead appeared in the Z3 plane, indicating these cells moved up along the Z-axis.

