Figure 3.
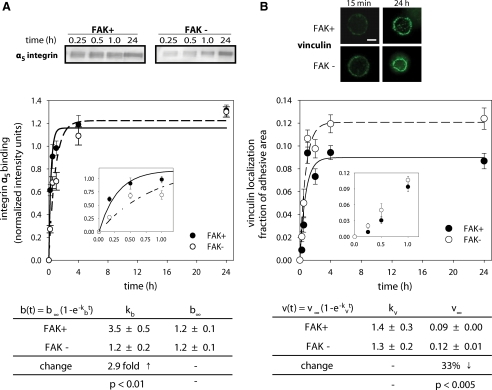
Kinetics of bound integrin and vinculin localization to focal adhesions for FAK-expressing (FAK+, ●) and FAK-null (FAK−, ○) cells. (A) Bound integrins were quantified using a cross-linking/extraction/reversal biochemical assay and Western blotting. Binding kinetics were fit to a simple kinetic model revealing differences in bulk bound integrin rate (kb) due to FAK expression, but no differences were found in the number of steady-state bound integrins (b∞). A minimum of 31 data points (five to six independent experiments) was used for the curve fits, and mean ± SE for each time point is shown. Inset shows bound integrin levels at short adhesion times showing significant differences between FAK+ and FAK− cells. (B) Immunostaining for vinculin recruitment to micropatterned adhesive area at early (15 min) and long-term (24 h) adhesion times (scale bar, 2 μm). Quantification of vinculin localization to adhesive area demonstrated no differences in vinculin recruitment rate (kv). At steady-state, localized vinculin levels (v∞) were significantly lower in the presence of FAK. A minimum of 129 data points was used for the curve fits, and mean ± SE for each time point is shown. Inset shows no differences in vinculin localization levels between FAK+ and FAK− at short adhesion times.

