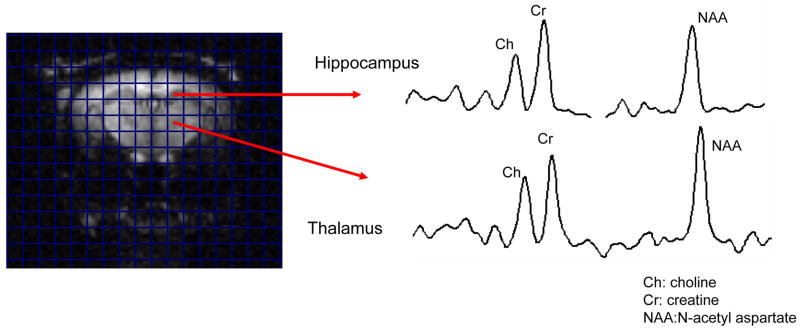
Fig. 9.
MRI/MRSI analyses show differences in regional brain metabolism between control and lupus mice. The figure illustrates the type of spectra obtained from the hippocampus (top) and thalamus (bottom), with a corresponding anatomical image of a lupus mouse brain. Data from the comparative analysis of lupus and control mouse brains is provided in Table 2.

