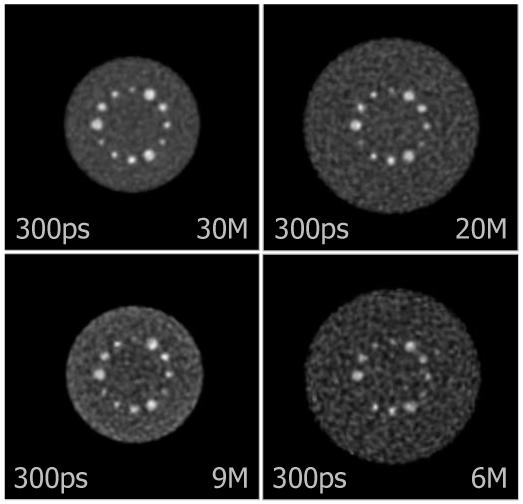
Fig. 13.

Central slices of DIRECT reconstructions at matched contrast levels for 10-mm sphere (marked by shaded bar in Fig. 12) from data with typical clinical count levels (30M and 20M) and very low count levels (9M and 6M) for objects emulating average (27 cm) and heavy (35 cm) patient sizes. As expected with a statistical reconstruction algorithm, the noise levels are determined by the number of counts in the data, and useful images are obtained even at very low count levels. These examples illustrate that the statistical algorithm performs as expected when operating on the data partitioning used in DIRECT.
