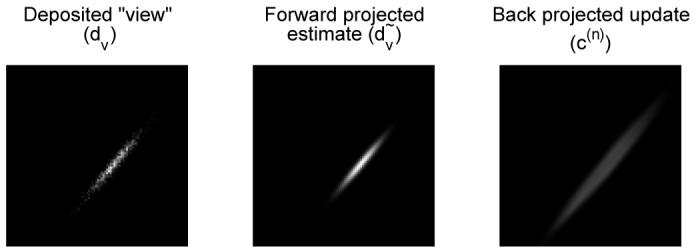
Fig. 3.

Examples of results of representative operations from Fig. 2. Left: central slice of 3D histo-image (dv) for view v (ϕ = 40° θ = 0°) containing 1000 deposited events simulated for an off-center point source. Middle: TOF forward-projection of an image containing a point source at the same location (both images are scaled to their own maxima). Right: correction image c(n) resulting from back-projection of the discrepancy image δv of the two above-mentioned images.
