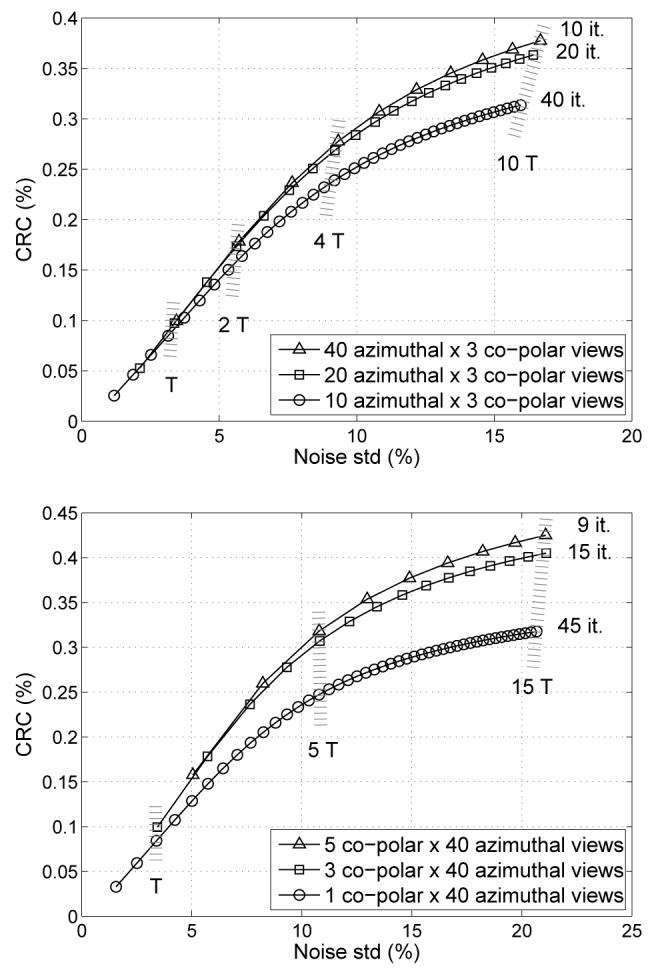
Fig. 8.

Illustration of view-grouping - azimuthal (top) and co-polar (bottom) - effects within the DIRECT approach on contrast vs. noise trade-offs for simulated data grouped into 10, 20, and 40 azimuthal (top) and into 1, 3, and 5 co-polar (bottom) angular intervals (curves for 10-mm lesions in 27-cm phantom, 30M counts, 600-ps TOF resolution). Each symbol location represents one iteration, i.e., one pass through all views for each case. T denotes one unit of computational effort equivalent to 1 iteration of the 40×3-views case (equal T values imply comparable reconstruction times). Note that grouping events into fewer views requires more iterations (but comparable time) to achieve approximately comparable contrast vs. noise trade-offs, if a sufficient number of views is used.
