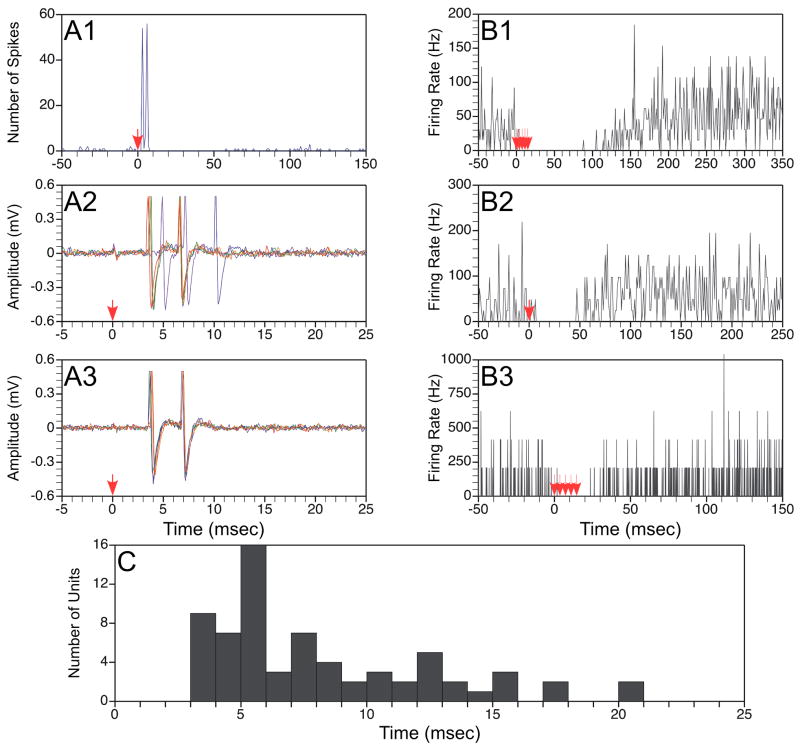
Figure 2.
Responses of thoracic neurons to electrical stimulation of the vestibular nerve. A: Responses of a neuron that exhibited short-latency excitation followed by inhibition during vestibular stimulation. Trace A1 is a poststimulus histogram showing the response to application of a single shock at 2T (80 μA) intensity to the ipsilateral labyrinth; the shock was delivered at time zero, as designated by an arrow. The histogram was generated from data collected following 55 stimulus repetitions. Traces A2 and A3 respectively show raw unit activity in response to a single shock delivered at 5T (200 μA) or 2T (80 μA) intensity; 5 sweeps are superimposed in each panel. B: Poststimulus histograms illustrating the responses of a neuron that was inhibited by stimulation of the contralateral labyrinth. Trace B1 shows the response to a train of 5 shocks at 5T (200 μA) intensity; B2 illustrates the effects of a single shock at 5T, whereas B3 indicates the effects of 5 shocks delivered at 2T (80 μA). C: the latency of the earliest response, elicited by stimulation of either the ipsilateral or contralateral labyrinth, of all units. Response latencies were measured from the effective shock. Data were excluded for two units whose response latencies were >25 msec.

