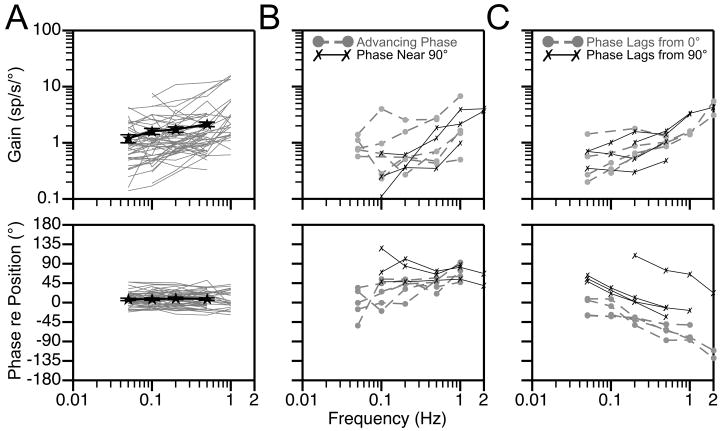
Figure 5.
Bode plots illustrating the dynamic properties of responses of putative thoracic interneurons to rotations at multiple frequencies. Response gain and phase are plotted relative to stimulus position. A: Bode plots for neurons whose response phases remained near stimulus position at all frequencies. Thin gray lines designate responses of individual neurons, whereas thick black lines show averaged data for all units. Error bars designate one standard error; for some points the errors were so small that the bars are not obvious. B: Bode plots for neurons whose response phases remained within 45° of stimulus velocity at all frequencies (phase near 90°) or exhibited a response phase near stimulus position at low rotational frequencies that advanced to near stimulus velocity at high frequencies (advancing phase). C: Bode plots for neurons whose responses developed a phase lag with respect to stimulus position (phase lags from 0°) or velocity (phase lags from 90°) as rotational frequency was increased. No data averages are provided in panels B or C, because so few cells exhibited the response characteristics that are highlighted.

