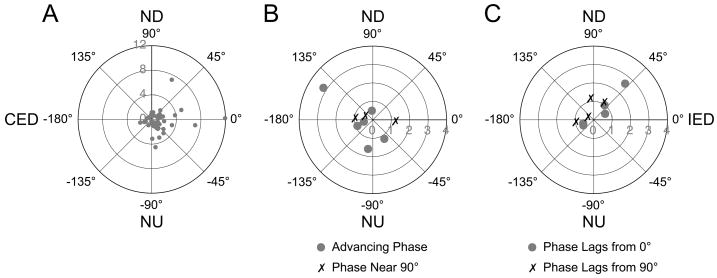
Figure 6.
Polar plots showing the response vector orientations and gains for thoracic interneurons, determined using wobble stimuli that were usually delivered at 0.2 Hz. Numbers along the radius of each plot indicate gain (spikes/s/°). A: Data for neurons whose response phases remained near stimulus position at all frequencies. B: Data for neurons whose response phases remained within 45° of stimulus velocity at all frequencies (phase near 90°) or exhibited a response phase near stimulus position at low rotational frequencies that advanced to near stimulus velocity at high frequencies (advancing phase). C: Data for neurons whose responses developed a phase lag with respect to stimulus position (phase lags from 0°) or velocity (phase lags from 90°) as rotational frequency was increased. Abbreviations: CED, contralateral ear-down roll; IED, ipsilateral ear-down roll; ND, nose-down pitch; NU, nose-up pitch.

