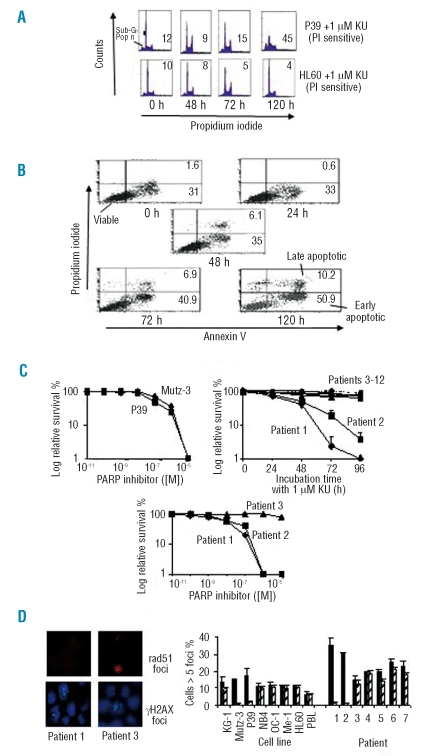
Figure 1.
The effect of PARP inhibitors on leukemic cells with defective DNA repair. A ( ) 1 μM KU was added to cells for 120 h and the cells were then analyzed by flow cytometry. The frequency of apoptotic cells was determined by estimating the cells in the sub-G1 compartment (lower left quadrant). The apoptotic index (sub-G1 population as a fraction of sub-G1 + G1 populations) is shown in the right inset. (B) 1 μM KU was added to P39 for 120 h before the cells were treated with annexin V-fluorescein isothiocyanate (FL-1, X-axis) and propidium iodide (FL-2, Y-axis). The figures show the percentages of early and late apoptotic cells in the population. (C) The effect of PARP inhibitors on cell survival. Cell survival was assessed by a soft agar clonogenic assay in cell lines and trypan blue exclusion in primary cells. Cells were continuously exposed to PARP inhibitors. KU was added at variable concentrations to human leukemic cell lines, P39, Mutz-3 and cells from AML patients. 1 μM KU was also added to cells from AML patients 1–12 continuously for 5 days and the cells then analyzed by trypan blue exclusion assay. (D) Immunostaining of nuclei from leukemic cells treated with 1 μM KU for 24 h. Cells were probed for γH2AX-P foci (green stain), rad51 foci (red stain) and nuclei were stained with DAPI (blue). The figure shows the frequency of cells displaying γH2AX-P foci(%) (black bars) or rad51 foci(%) (diagonal bars), as detected by immunofluorescence following addition of KU. More than 300 nuclei were counted per experiment, n=3.

