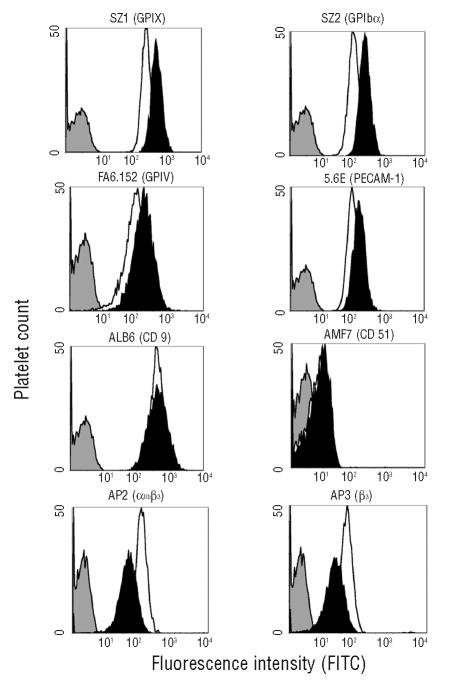
Figure 3.
Flow cytometry of surface glycoproteins on platelets from the proband (black histograms) and controls (white histograms). The expression of CD9, αvβ3, GPIb/IX/V, PECAM-1 or GPIV on the platelet surface was normal, or slightly increased. In contrast, expression of GPIIIa (integrin β3) and the complex GPIIb/IIIa (αIIbβ3) was reduced. The gray curve is a non-specific signal.

