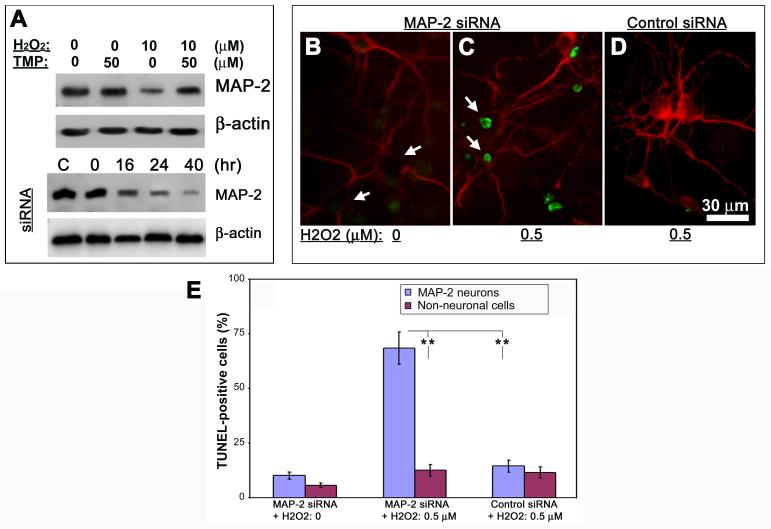
Fig. 5. Prevention of MAP-2 loss by TMP in association with neuronal resistance to ROS stress.
(A) Cells were treated as indicated on the top of the first two panels. Western blots show decreased abundance of MAP-2 protein in H2O2-treated cells, which is prevented by addition of TMP (first panel). In the separate experiments, whole-cell lysates were prepared from cells transfected with 100 pmol MAP-2 siRNA and Western blotting was performed to show the levels of MAP-2 at indicated times (on the top of third panel). C = control, which was from cells 40 hr after control siRNA transfection. β-actin was used as loading controls. (B-D) Cells were transfected with MAP-2 or control siRNA and treated as indicated on the bottom of the panels at 16 hr following transfection. Double-labeling of MAP-2 (red) and TUNEL (green) shows the loss of MAP-2 immunoreactivity in neuronal soma due to siRNA transfection but lack of TUNEL signal in cells without other treatments (arrows in B); TUNEL-positive cells are detected in MAP-2 siRNA-transfected cells 24 hr after exposure to 0.5 μM H2O2 (arrows in C); Control siRNA shows no effects on MAP-2 immunoreactivity nor TUNEL signal in cells following 24 hr exposure to 0.5 μM H2O2 (D). (E) The number of TUNEL-positives cells relative to either MAP-2-labeled neurons, of which part of them had very low MAP-2 signal in neuronal soma, or fully MAP-2-negative non-neuronal cells following the treatments as indicated on the bottom of the chart. Bars depict mean ± S.E.M., **p < 0.01 (N = 4).

