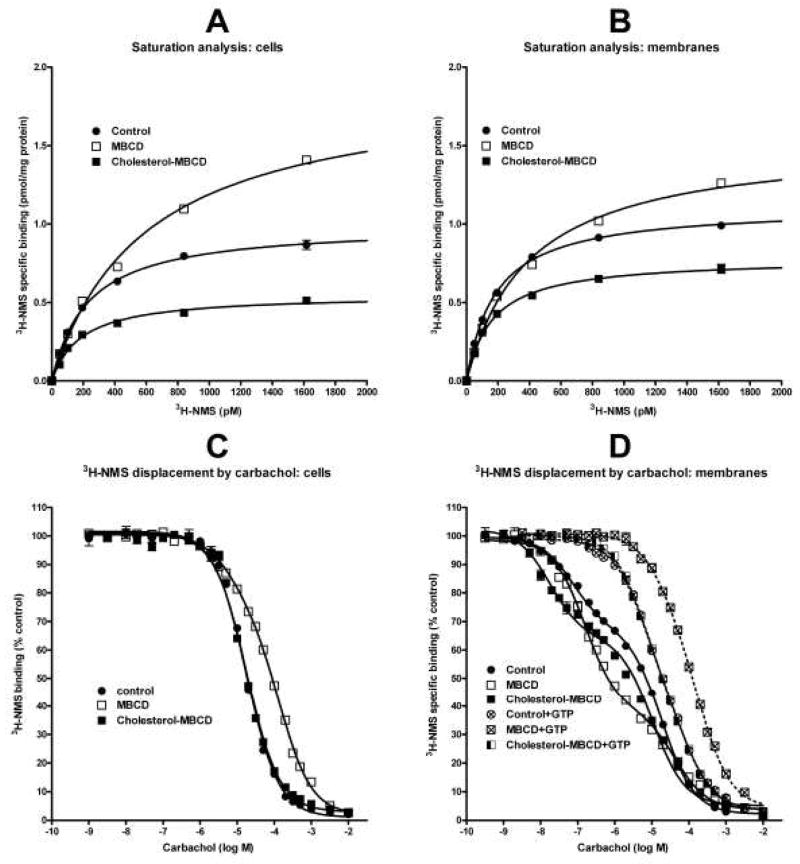
Fig. 1.
Binding of [3H]-NMS and carbachol in cells and membranes after cholesterol depletion or cholesterol enrichment. A and B: Specific [3H]-NMS binding in intact cells (A) and membranes (B) is fitted as a saturation isotherm (abscissa, concentration of [3H]-NMS; ordinate, specific binding in pmol/mg protein). Shown is a representative experiment. Each point is the mean±S.E.M. of triplicate values. When S.E.M. is not depicted it was smaller than the symbol. Parameters of non-linear regression fits are shown in Table 2. C and D: Displacement of 0.6 nM [3H]-NMS by carbachol (abscissa, log M) is expressed as percent of control (ordinate) in intact cells (C) and membranes (D) without or with added GTP as indicated. Each point is the mean±S.E.M. of six values from two independent experiments. One- or two-site competition equation is fitted to data as appropriate. Parameters of fits are shown in Table 3. Control, cells or membranes derived from untreated cells; MBCD, cholesterol-depleted cells or membranes prepared from these cells; Cholesterol-MBCD, cholesterol-enriched cells or membranes derived from these cells. Dashed lines in (D) denote competition curves in membranes incubated in the presence of 10 mM GTP.

