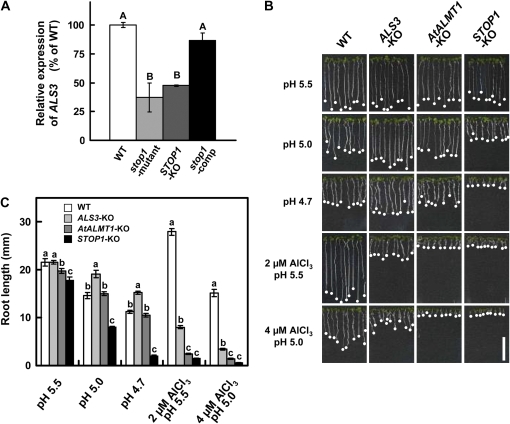
Figure 2.
Repression of ALS3 in the stop1 mutant and comparison of growth among T-DNA insertion mutants. A, ALS3 expression in the wild type (WT), the stop1 mutant, STOP1-KO, and a complemented line of the stop1 mutant carrying CaMV35S∷STOP1 (stop1-comp), which were grown for 10 d in normal conditions and exposed to Al (10 μm, pH 5.0) for 24 h. ALS3 expression was normalized by UBQ1 expression and compared with that of the wild type. B and C, Growth response of ALS3-KO compared with that of STOP1-KO and AtALMT1-KO with Al and H+ rhizotoxicities. White bar in B = 1 cm. Different letters indicate significant differences by lsd test (P = 0.05). [See online article for color version of this figure.]

