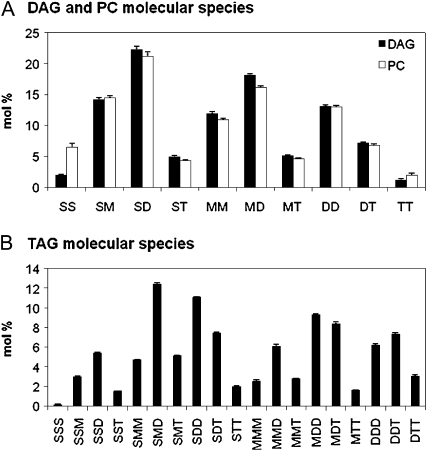
Figure 1.
Endogenous molecular species compositions of DAG, PC, and TAG from developing soybean embryos of 13 to 14 mg dry weight per embryo precultured for 3 d, as determined by ESI-MS/MS. Molecular species are represented as two or three FAs (no stereochemistry specified). Bar heights represent mol % of each species among the total. For comparison to radiolabeled molecular species separated by argentation TLC as shown in later figures, the molecular species here are grouped based on the individual FA number of double bonds: total saturates (16:0, 18:0, 20:0, etc.), S; monoenes (18:1), M; dienes (18:2), D; and trienes (18:3), T. Full molecular species measurements of the nongrouped lipid molecular species for TAG, DAG, and PC are in Supplemental Tables S1 and S2, respectively. A, DAG (black bars) and PC (white bars). B, TAG.

