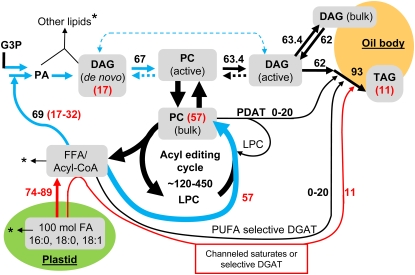
Figure 10.
Soybean TAG synthesis acyl flux model. The assumptions and flux calculations are presented online. The model follows 100 mol of newly synthesized FA in the plastid through the major fluxes of lipid metabolism such that the final accumulations of FAs are TAG, 93 mol; PC, 3.6 mol; DAG, 1.4 mol; and other lipids, 2 mol. Other membrane lipids in soybean embryos are mostly PE and PI. The arrows indicate the fluxes, with the major metabolite pools proposed from kinetic analysis highlighted in gray. Dashed arrows represent uncertainty for that reaction. The black numbers represent total net steady-state fluxes or flux ranges as calculated online. The arrows highlighted in blue and red represent the major initial fluxes of newly synthesized FA as measured by [14C]acetate labeling. Blue arrows represent fluxes where nascent and endogenous acyl groups mix, while red arrows indicate only nascent FA. The red numbers represent the initial accumulation of nascent FA into the major labeled glycerolipids PC, DAG, and TAG, which together accumulate approximately 85% of initial FA. Approximately 15% of nascent FA initially accumulates in lipids other than PC, DAG, and TAG. The asterisks represent small fluxes of acyl groups to these other lipids, for which products and/or mass flux analysis have not been determined.

