Figure 3.
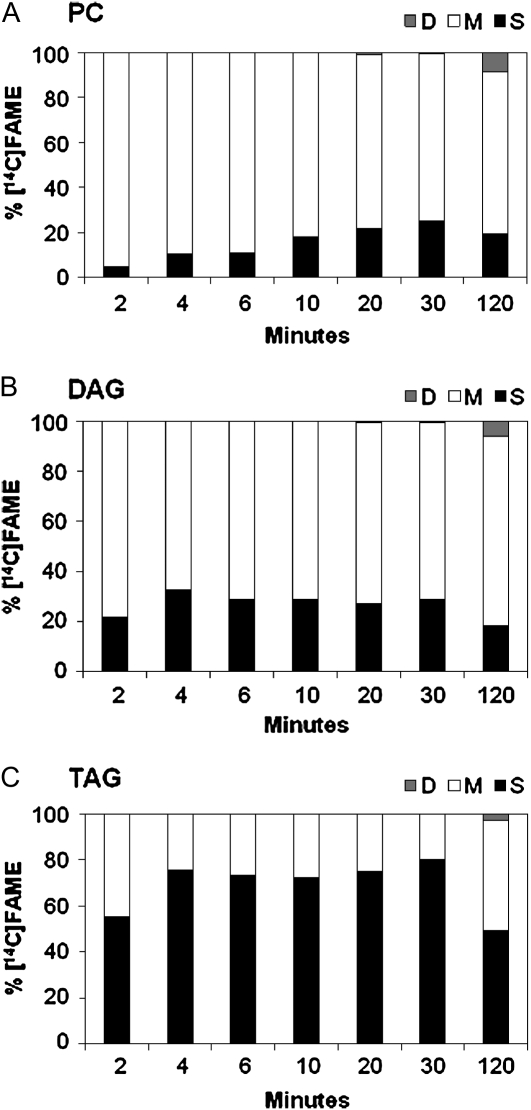
Radiolabeled FA composition of [14C]acetate-labeled lipids presented in Figure 2. Each bar shows the distribution of radioactivity among different acyl groups at each time point. Bar shading: total saturates, S, black; monoenes (18:1), M, white; and dienes (18:2), D, gray. A, PC; B, DAG; C, TAG.

