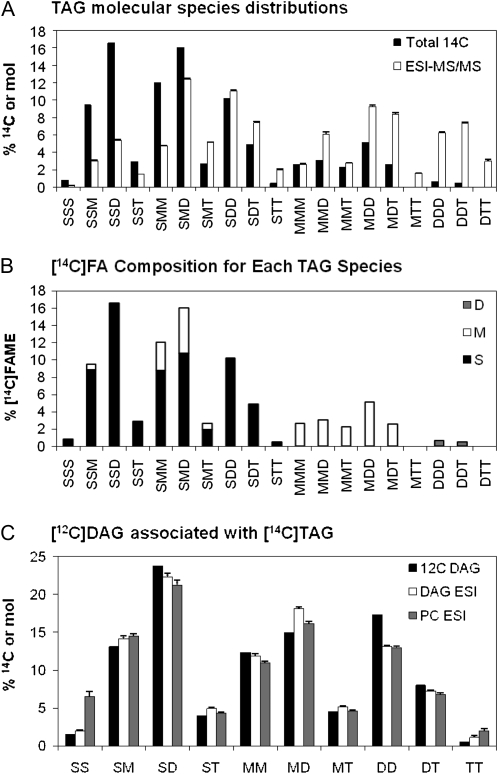
Figure 6.
Analysis of TAG molecular species separated by argentation TLC after 6 min of labeling of soybean embryos with [14C]acetate. Molecular species nomenclature as given in Figure 1. A, [14C]Acetate-labeled molecular species (black bars) and endogenous molecular species from Figure 1 (white bars). B, Labeled FA composition within each molecular species of [14C]acetate-labeled TAG. Bar shading represents the labeled FA within each molecular species: saturates, S, black; monoenes (18:1), M, white; dienes (18:2), D, gray; and trienes, T. C, Calculated unlabeled DAG molecular species associated with labeled TAG in B, assuming one sn-3-labeled FA per molecular species (black bars). Endogenous molecular species from Figure 1: DAG (white bars) and PC (gray bars).

