Figure 6.
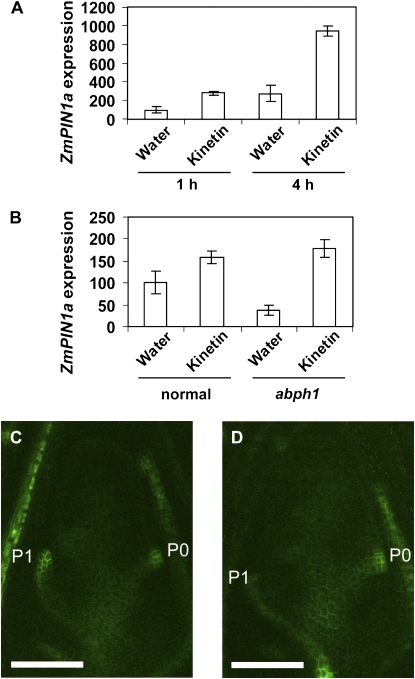
ZmPIN1a expression is rapidly induced by cytokinin in the SAM. A, Quantification of ZmPIN1a expression by semiquantitative RT-PCR using total RNA from single normal meristems treated with water or 100 μm kinetin for the indicated times. Expression levels (arbitrary units) were normalized based on ubiquitin expression levels. The 1-h water control levels were adjusted to 100 (n = 3; error bars indicate se). B, Quantification of ZmPIN1a by semiquantitative RT-PCR using total RNA from single normal or abph1 mutant meristems treated with 10 μm kinetin for 4 h. Expression levels (arbitrary units) were normalized based on ubiquitin expression levels. Levels of water control of normal samples were adjusted to 100 (n = 4; error bars indicate se). C, Confocal image of ZmPIN1a-YFP expression in a median longitudinal section through SAM of a seedling treated with control solution for 4 h. D, Confocal image of ZmPIN1a-YFP expression in a median longitudinal section through SAM of a seedling treated with 100 μm kinetin for 4 h. Bars = 100 μm. Additional images are shown in Supplemental Figure S3.

