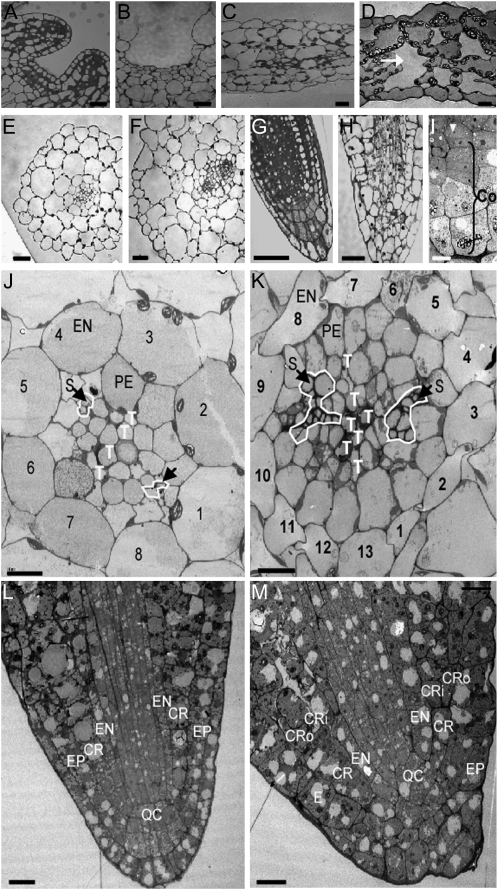
Figure 4.
Tissue phenotypes in gsl8 mutant seedlings. A to D, Light micrographs of sections of shoot apical meristems (A and B) and cotyledons (C and D). Compared with the wild type (A and C), gsl8-4 meristem (B) and mesophyll (D) tissues are disorganized. The arrow in D shows a large intercellular space. E to H, Cross sections of hypocotyls (E and F) and longitudinal sections of roots (G and H) from the wild type (E and G) and the gsl8-4 mutant (F and H). I, TEM of columella cell layers in gsl8-4. The arrowhead indicates the quiescent center. J and K, TEM of hypocotyls in cross section of the wild type (J) and gsl8-4 (K) with endodermal cells numbered. L and M, TEM of the root tip in the wild type (L) and gsl8-4 (M). Co, Columella cells; CR, cortex; CRi, internal layer of cortex; CRo, outer layer of cortex; EN, endodermis; EP, epidermis; PE, pericycle; QC, quiescent center; S, sieve elements; T, tracheary elements. Similar patterns were observed from gsl8-1 and gsl8-2 mutants. Bars = 20 μm in A to D and I, 30 μm in E to H, and 10 μm in J to M.

