Figure 7.
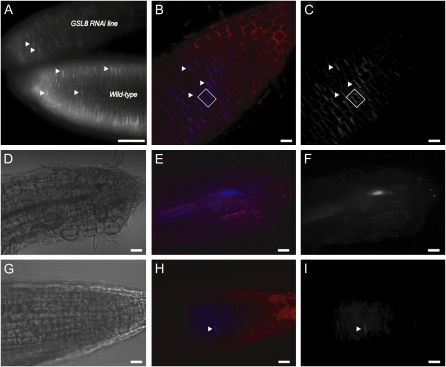
Callose deposition at cell plates and new cell walls. A, Comparison of images of the same roots using fluorescence optics from aniline blue staining of the wild type (bottom root) and a dexamethasone-treated GSL8 RNAi line (top root). Bar = 30 μm. B to I, Confocal images following aniline blue and FM4-64 staining from root tips of 1-week-old plants of the wild type (B and C), the gsl8 mutant (D–F), and a dexamethasone-induced GSL8 RNAi line (G–I). Merged images of aniline blue (blue) and FM4-64 fluorescence (red) are shown in B, E, and H. Gray-scale images of the blue channel are shown in C, F, and I. Bright-field images are shown in D and G. Arrowheads indicate representative aniline blue staining. Boxes indicate callose bands on two opposite sides of a cell, suggesting that at least one of them is a new cell wall that originated from the cell plate. Bars = 20 μm.

