Figure 3.
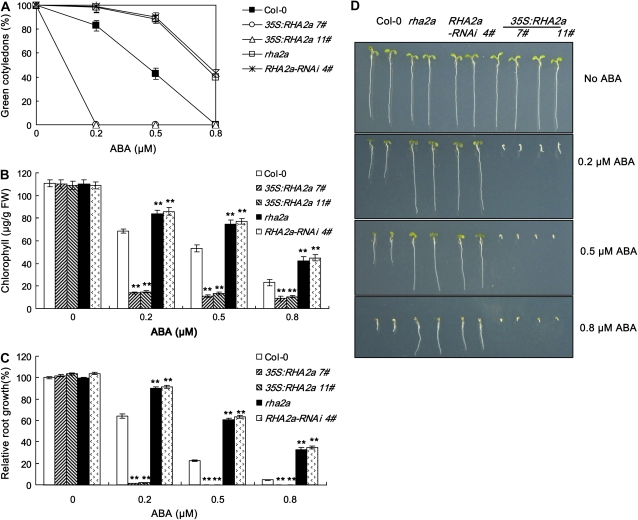
ABA response of rha2a, RHA2a-RNAi, and 35S:RHA2a plants during early seedling development. A, Quantification of cotyledon greening. Cotyledon-greening percentage of the indicated genotypes grown on medium containing different concentrations of ABA was recorded at 5 d after the end of stratification (see “Materials and Methods”). Data show the mean ± sd of three replicates. At least 100 seeds per genotype were measured in each replicate. B, Quantification of chlorophyll content. Seedlings described in A were collected for chlorophyll a/b extraction and measurement. Values represent the mean ± sd of three replicates. FW, Fresh weight of whole seedlings. C, Root growth measurements. Seedling root length of the indicated genotypes grown on medium containing different concentrations of ABA was measured at 5 d after the end of stratification (see “Materials and Methods”). Relative root growth compared with that on ABA-free medium is indicated. Data show the mean ± sd of three replicates. At least 30 seedlings per genotype were measured in each replicate. D, Photographs of seedlings at 5 d after the end of stratification. Twenty-four hours after stratification, germinated seeds were transferred from ABA-free medium to medium containing 0.5 μm ABA. Asterisks in B and C indicate the significance of the difference from the corresponding wild-type values determined by Student's t test (** P < 0.01). At least three independent experiments were conducted and similar results were obtained. [See online article for color version of this figure.]

