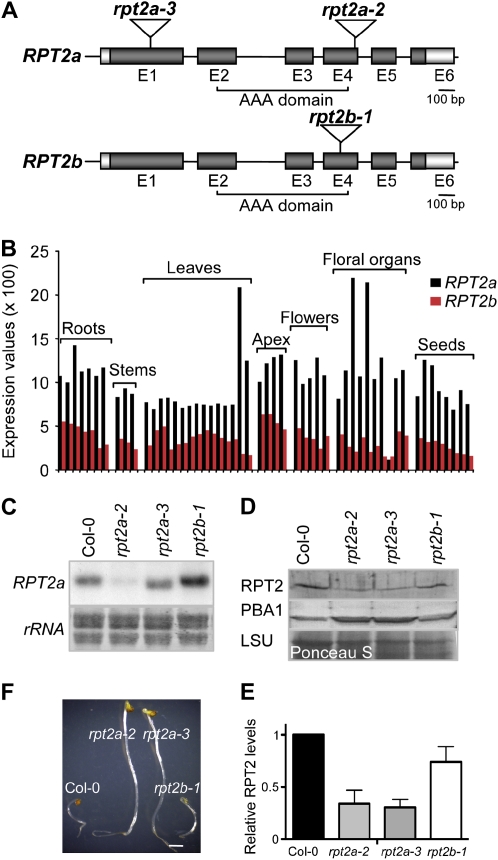
Figure 1.
Molecular analyses of rpt2 mutants. A, RPT2a and RPT2b gene structures and the positions of the T-DNA insertions. Exons (E) and introns are represented by boxes (dark gray, coding region; light gray, untranslated region) and lines, respectively. Insertion positions of the T-DNA in the rpt2a-2 (SALK_005596), rpt2a-3 (SALK_130019), and rpt2b-1 (SALK_043450C) alleles are shown. B, RPT2 expression levels during Arabidopsis development. The developmental data set of the AtGenExpress project was used (Schmid et al., 2005). Different bars in the same category denote the different developmental stages as specified by Schmid et al. (2005). C, Expression analyses. RNA gel blots were probed with an RPT2a antisense probe. The region of a methylene blue-stained membrane encompassing ribosomal RNAs (rRNA) is shown as a loading control. D, RPT2 protein level in rpt2a mutants. Protein extracts from 10-d-old Col-0 and rpt2 mutant plants were separated by SDS-PAGE, blotted, and probed with anti-RPT2 and anti-PBA1 antisera. A region of the Ponceau S-stained membrane encompassing the large subunit of Rubisco (LSU) is shown as a loading control. E, Relative levels of RPT2 protein were assessed by densitometry from four immunoblots. The signal intensity of Col-0 was normalized to 1, and mean values ± sd are shown. F, MG132 tolerance of rpt2 mutants. Seeds were sown and grown for 5 d in darkness on water/agar containing 50 μm MG132. Bar = 1 mm. [See online article for color version of this figure.]

