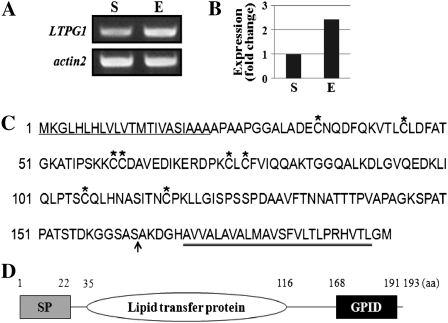
Figure 1.
Isolation of the LTPG1 gene. A and B, Expression of the LTPG1 transcripts in stems (S) and stem epidermal peels (E). Total RNA (0.1 μg) was used for RT-PCR (A) and quantitative RT-PCR (B) analyses. The actin2 gene (At3g18780) was used to determine the quantity and quality of the cDNA. Each value in B is the mean of duplicate experiments. C, Amino acid sequences of the LTPG1 protein. Asterisks denote the conserved Cys residues. The signal peptide domain and GPI-anchored domain are underlined and double underlined, respectively. The arrow indicates the EYFP insertion site for subcellular localization of LTPG1. D, Schematic diagram of the LTPG1 protein. GPID, GPI-anchored domain; SP, signal peptide domain.

