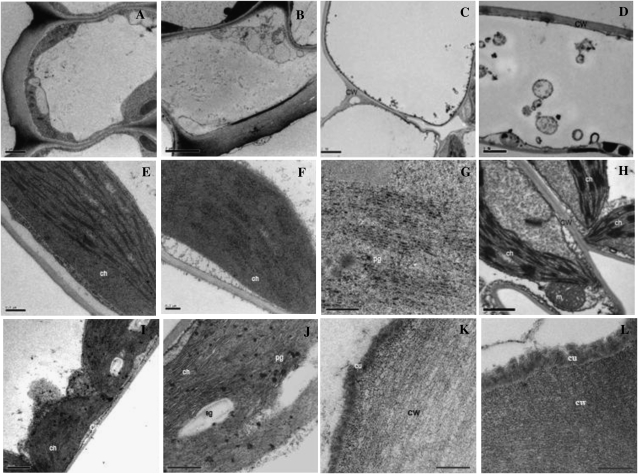
Figure 7.
Transmission electron micrographs of wild-type and ltpg1 mutant plants. A and B, Stem epidermal cells of the wild type (A) and the ltpg1 mutant (B). C and D, Leaf epidermal cells of the wild type (C) and the ltpg1 mutant (D). E and F, Stem cortex chloroplasts of the wild type (E) and the ltpg1 mutant (F). G, High-magnification image of F. H and I, Leaf mesophyll cell chloroplasts of the wild type (H) and the ltpg1 mutant (I). J, High-magnification image of (I). K and L, Cuticle layers of the wild type (K) and the ltpg1 mutant (L). Transmission electron microscopy analysis was repeated three times. ch, Chloroplast; cu, cuticle; cw, cell wall; m, mitochondrion; pg, plastoglobule; sg, starch granule. Bars = 2 μm (A–C), 1 μm (D, H, and I), 0.5 μm (E and J), and 0.2 μm (F, G, K, and L).

