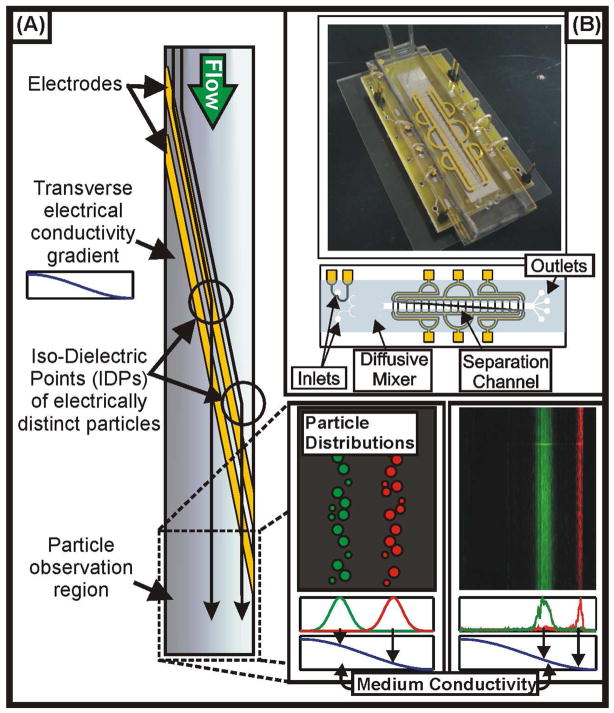
Figure 1.
Concept of the IDS device. (A) Cells and particles flow through a channel with electrodes across the diagonal and a conductivity gradient across the width (decreasing from left to right in the figure). The electrodes dielectrophoretically deflect cells or particles across the conductivity gradient until they reach their iso-dielectric point (IDP), where they pass over the electrode barrier. Finally, they flow to an observation region, where the cells and particles are imaged to determine their spatial distributions, and to outlets, where fractionated samples may be collected. (B) Photograph (top) and schematic (bottom) showing the packaging and layout of the device, respectively. The conductivity gradient is created by loading the two inlets with different conductivity solutions and then passing them through a diffusive mixer prior to the separation channel.

