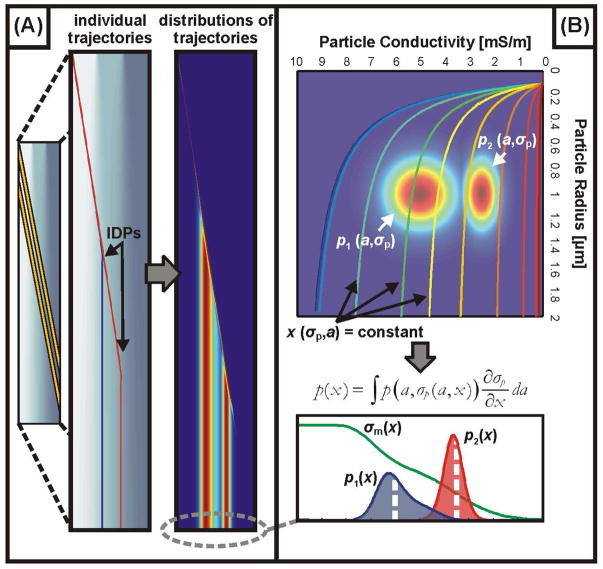
Figure 2.
Modeling and interpreting the distribution of particle trajectories through the device. (A) Simulations to determine individual particles’ trajectories (left) and distributions of these trajectories (right) for suspensions containing particles with a distribution of sizes (a) and conductivities (σp). (B) Relating the distribution of physical properties (size and conductivity, in this case), to the spatial distribution of particles at the outlet (p(x)) by integrating the property distributions (appropriately weighted) over contours of constant outlet positions. By fitting spatial distributions from this model to the observed distributions, we are able to infer how certain physical properties are distributed across the suspension.

