
Figure 3.
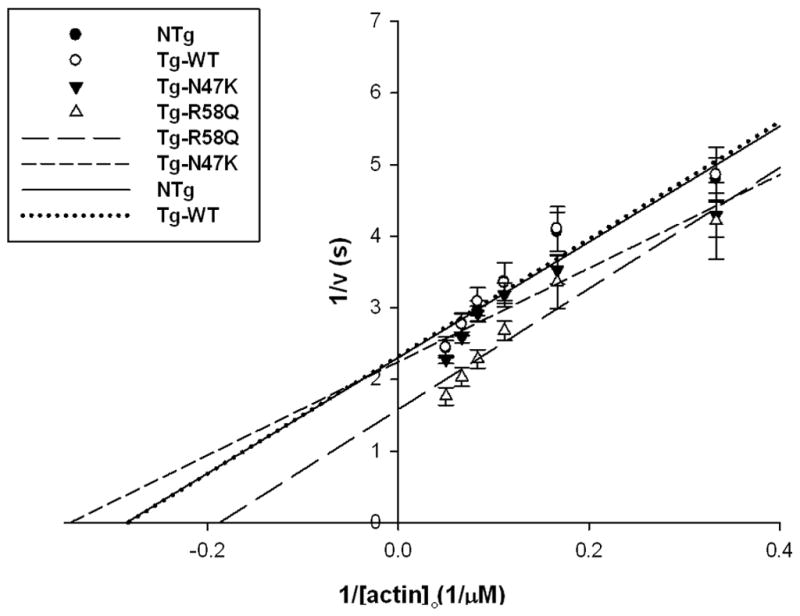
Actin activated ATPase rates of the WT, NTg, N47K, and R58Q. As can be seen WT, NTg, and N47K have similar Vmax values while R58Q showed an increase in actin activated ATPase rates expressed by increased Vmax. Data points are average from 4 independent experiments ± standard error of the mean Data was fit as described in the methods.