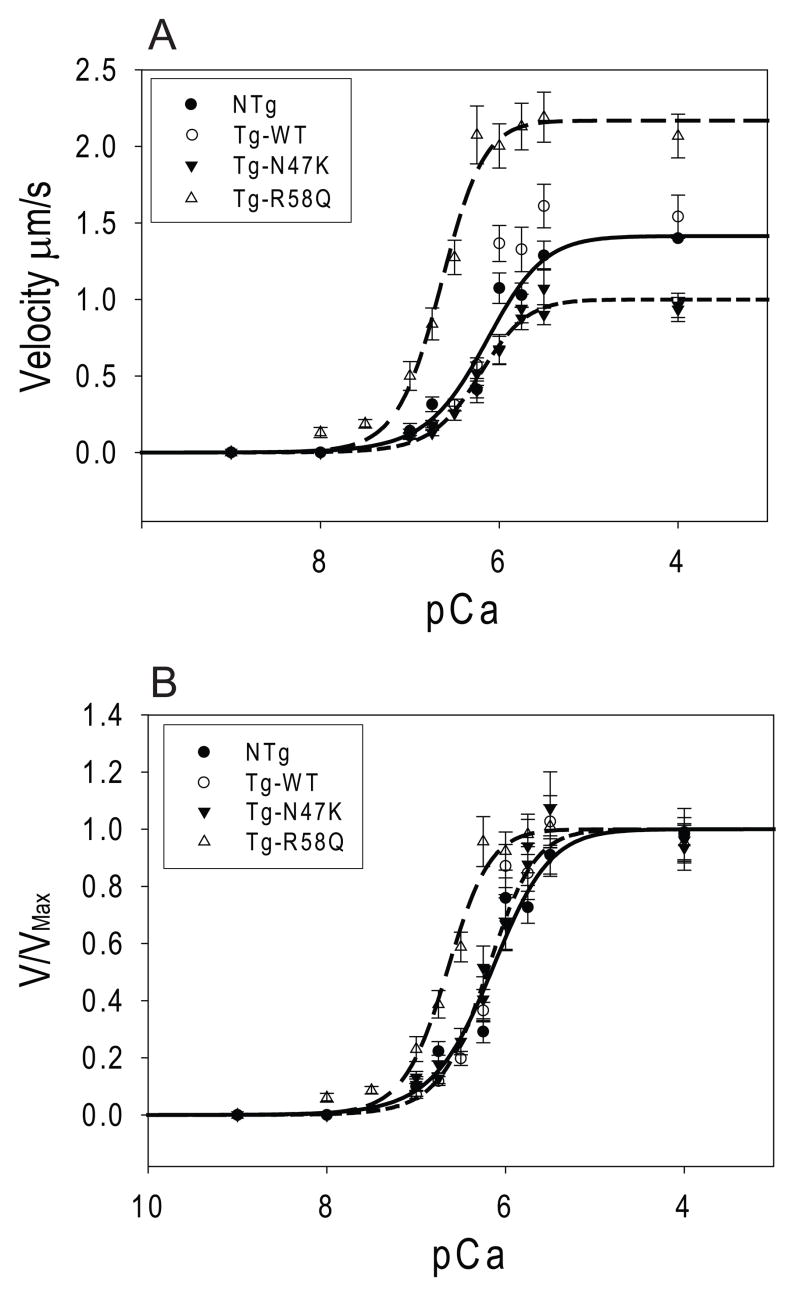
Figure 5.
Actin filaments were reconstituted with troponin and tropomyosin and the actin filament sliding velocity was measured as a function of added calcium. Data was fit to Hill curves as described in the methods (Eq. 6). Plotted are the (A) raw data and (B) normalized data. As can be seen, R58Q (long-dashed line) shows a significant shift in the pCa50 of activation compared to the WT (dotted line) and NTg (solid line) whereas N47K (short-dashed line) shows no change in the pCa50.

