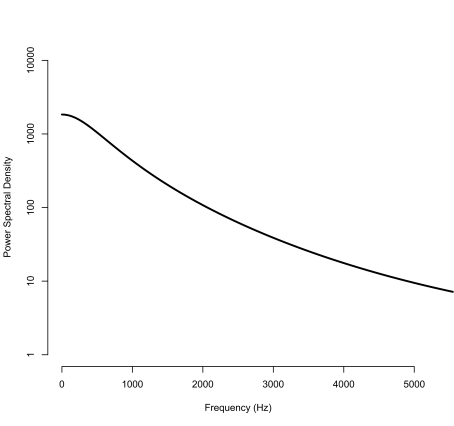
Figure 2.
The zoomed-in power spectral density of SetA_UT1 (0–5,000 Hz). The power spectral density clearly shows 1/f noise in the low frequency region. The DC offset is not zero even though the means of the individual mass spectra of noise from instrumentation were removed before the Burg algorithm for segments was applied. The DC offset may be explained by the bias between the true mean and the mean estimates of the mass spectra and the effect of 1/f noise near 0 Hz.

