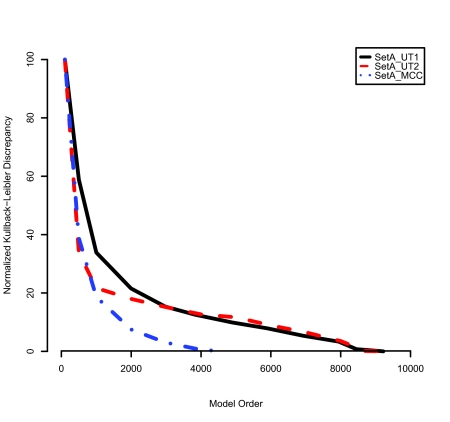
Figure 4.
Normalized KLDs of the AR models with respect to the validation mass spectra. The KLD of each AR model is normalized with respect to its maximum and minimum values, and then multiplied by 100. The black solid line is the KLD of SetA_UT1, the red dashed line is that of SetA_UT2, and the blue dashed dot line is that of SetA_MCC. The optimal model order of each model is decided at the point where its KLD stops decreasing.

