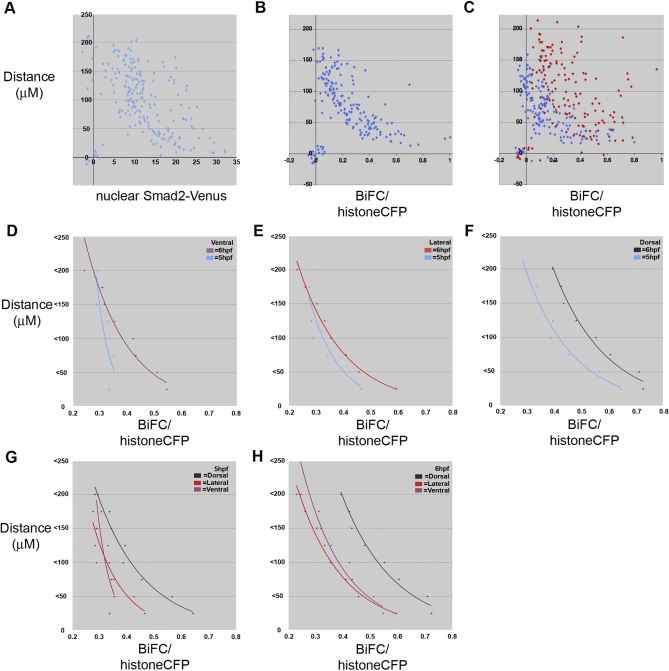
Figure 3. Quantification of Endogenous Nodal Signalling.
Plots of the nuclear Smad2-Venus fluorescence intensity in transgenic embryos (A, x-axis), or the ratio of nuclear Smad2/4 BiFC to histone CFP (B–H, x-axis), against distance from the margin (near zero) towards the animal pole (>200 μm) of the embryo (μm, y-axis). All graphs are plotted with the average distance and intensity of nuclei in the YSL as zero. (A) Nuclear Smad2-Venus fluorescence intensity in a 6 hpf transgenic embryo.
(B) Nuclear Smad2/4 BiFC in a wild type 5 hpf embryo.
(C) Comparison of Smad2/4 BiFC in lateral cells of the same embryo at 5 hpf (blue) and 6 hpf (red).
(D–H) A comparison of the average BiFC intensity of all nuclei within 25-μm intervals of multiple embryos. (D–F) A temporal analysis of the average nuclear BiFC intensity in ventral cells (D), lateral cells (E), and dorsal cells (F) at 5 hpf (blue in all three) and 6 hpf. (G and H) A spatial analysis of nuclear BiFC at 5 hpf (G) and 6 hpf (H). As in (D–F), purple = ventral cells, red = lateral cells, and black = dorsal cells. The number of embryos used to calculate the average intensity for 5 hpf was: 7 ventral, 10 lateral, and 7 dorsal; numbers of embryos used for 6 hpf was: 5 ventral, 6 lateral, and 6 dorsal.

