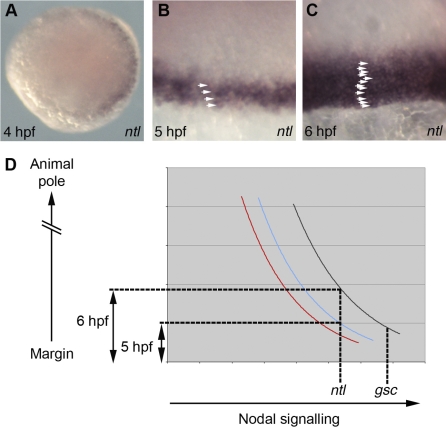
Figure 4. Spatial and Temporal Induction of Nodal Target Genes.
(A–C) Analysis of ntl expression. (A) Animal pole view of a 4 hpf embryo. (B and C) Views of the margin at 5 hpf (B) and 6 hpf (C) with arrowheads highlighting ntl expressing cells.
(D) Graphical representation of Smad2/4 BiFC quantifications in Fig's 3E-F. Black: 6 hpf dorsal cells; blue: 5 hpf dorsal cells; red: 6 hpf lateral cells.

