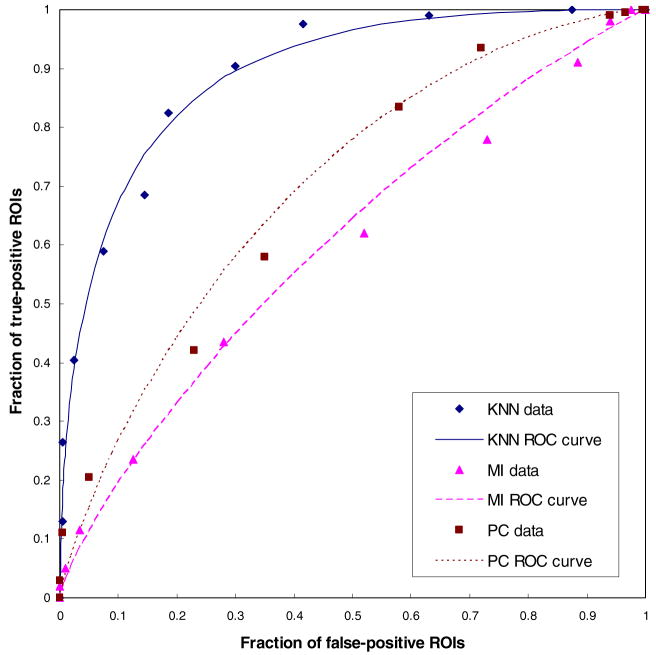
Figure 3.
Comparison of three sets of performance data and ROC curves. The areas under ROC curves are 0.893 ± 0.009, 0.606 ± 0.0205 and 699 ± 0.026 for three CBIR schemes based on multi-feature KNN, mutual information (MI) and Pearson’s correlation (PC) methods using the fixed ROIs with 512 × 512 pixels, respectively.

