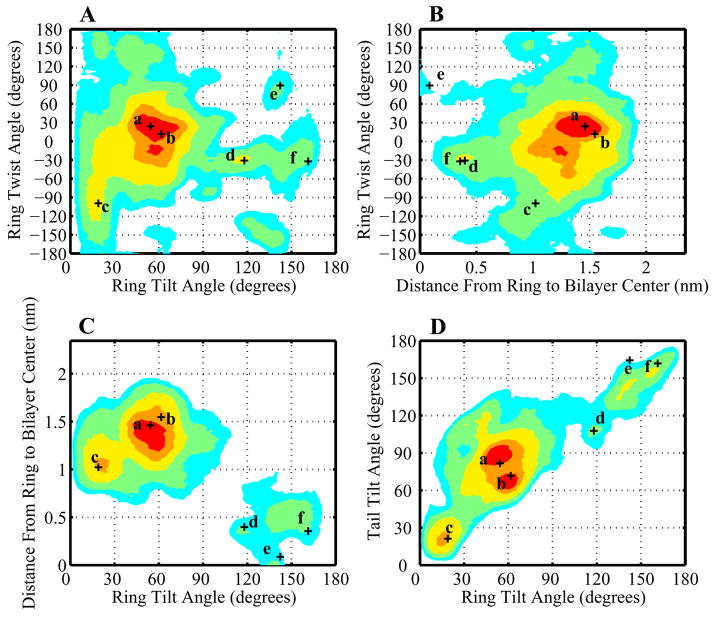
Figure 11.
A contour plot as in Figure 10 showing the distribution of 25-hydroxycholesterol orientations in mixed POPC/oxysterol bilayers. Regions containing the densest 10%, 25%, 50%, 75%, and 90% of the total probability density are shown by areas of red, orange, yellow, green, and cyan respectively. (A) Ring tilt β vs. ring twist γ (B) Ring tilt β vs. ring height, calculated as the average distance of carbons 3 and 13 from the bilayer center. (C) Ring height vs. ring twist γ (D) Ring tilt β vs. tail tilt β′. Labelled crosses show the orientations of the specific sterol molecules depicted in Figure 13.

