
Figure 3.
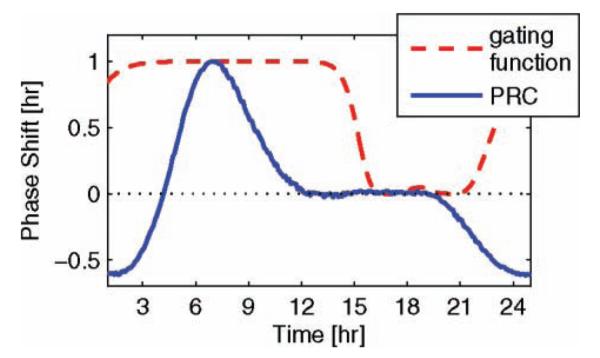
Gated circadian phase response. The x axis reflects time at which a 3-h pulse of light is applied to the model (via an additive light input), while the y axis reflects the resulting phase shift; a positive shift denotes an advance. The pulses of light are gated through use of a state-based gating function that decreases the effect of light during the subjective day. The output of this gating function is depicted by the red dash-dot line.