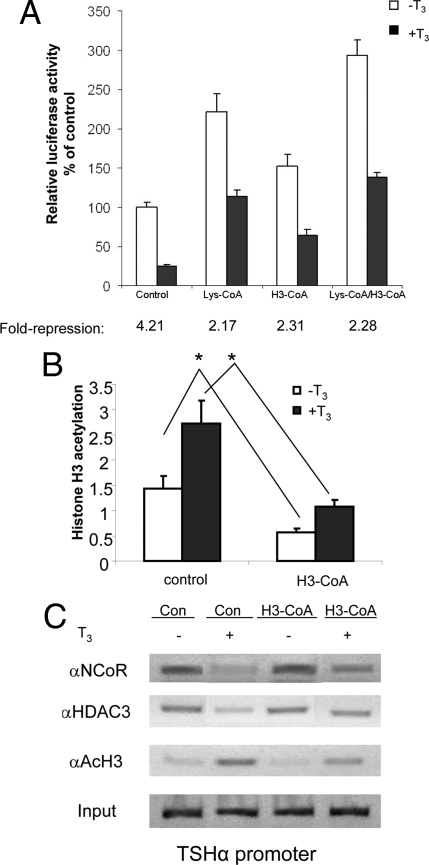
Figure 5.
TSHα transcripitonal activity and corepressor complex binding after blocking with P/CAF and CBP/p300 HAT inhibitors. A, Effects of two HAT inhibitors on TSHα promoter activity. α-23 cells were seeded in 24-well plates and cultured in T3-free 10% FBS-DMEM medium for 3 d. Ten microliters of digitonin solution (50 mg/ml) were added to the wells 10 min before the addition of the HAT inhibitors, Lys-CoA and H3-CoA. T3 (0.1 μm) was added to the wells, and cells were cultured overnight. The cell lysates were prepared, and luciferase activities were measured as in Fig. 1. Shown are the mean of triplicate samples ± sd normalized to control as 100%. Similar findings were observed in two other experiments. *, P < 0.05 difference between indicated samples using ANOVA. B, Quantitative RT-PCR analyses of PCR products from using anti-acetyl H3 antibody (n = 3). α-23 cells were treated with H3-CoA overnight as above and then treated for 1 h with T3 before harvest for ChIP assay. Statistical analyses were performed as in Fig. 1. *, P < 0.05. C, Effects of a HAT inhibitor on NCoR and HDAC3 binding to TSHα promoter. α-23 cells were grown in T3-free 10% FBS-DMEM for 3 d and then treated with P/CAF inhibitor, H3-CoA, and H3-AC (Con) overnight as in Fig. 4B. Cells then were treated for 1 h with 0.1 μm T3 before harvest, and ChIP assay was performed as described in Materials and Methods using NCoR and HDAC3 antibodies. Similar findings were observed in two other experiments.

