Figure 2.
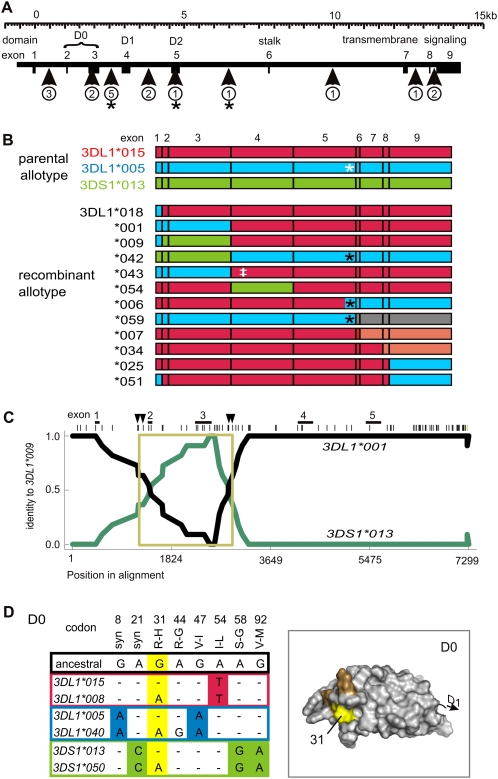
Motif and domain shuffling between three lineages diversifies 3DL1/S1. (A) Shown to scale is the genomic organization of the 3DL1/S1 locus. (Boxes) Exons; exons 2–5 encode the three Ig domains, D0, D1, and D2. (Vertical arrows) The genomic regions and the number of recombination events detected from comparison of 3DL1/S1 alleles. (*) Recombination event that placed residue leucine 283 onto a different background allotype. (B) Schematic of 12 recombinant alleles of 3DL1/S1 that were identified using domain-by-domain phylogenetic analysis. The recombinant allotypes are represented by segments colored according to allelic lineage: (red) 015, (blue) 005, (green) 3DS1. The allotypes shown at the top of the panel are encoded by the most common modern alleles: 3DL1*01502, 3DL1*00501, and 3DS1*01301. For example, 3DL1*001 is identical to 3DL1*00501 in exons 1–3 and 3DL1*01501 in exons 4–9. (Gray) Recombination from another locus (3DL2); (pink) within-lineage recombinants. (White asterisk) Tryptophan–leucine substitution at residue 283; (black asterisk) recombination has replaced tryptophan at residue 283 with leucine; (‡) threonine 118 that distinguishes 3DL1*043 from 3DL1*001 and is shared with 3DL1*038. (C) The pairwise identity plot shows that 3DL1*009 formed by gene conversion. (Black line) Identity of 3DL1*009 with 3DL1*001; (green line) identity of 3DL1*009 with 3DS1*01301. The recombination included exons 2 and 3, which encode D0. (Across the top, vertical bars) SNP markers; (vertical arrows) the minimum and maximum limits of the gene conversion. Genomic sequences used for the RDP analysis include representatives of the three allelic lineages of 3DL1/S1 (listed in Methods). The 3DL1*009 cDNA sequence that was independently obtained (Middleton et al. 2007) corresponds precisely to the reading frame of the locus characterized here. (D) Shown for each of the 3DL1/S1 lineages is a pair of alleles that are dimorphic at (yellow) codon 31. Nucleotide differences in D0 are shown, and those that distinguish the three lineages are colored as in panel A. (Top) Amino acid substitutions with the ancestral residue first and the ancestral nucleotide immediately below. (Right panel) A homology model of D0; residue 31 (yellow) occurs in a patch of positively selected residues (orange) that were identified in Norman et al. (2007).

